I’ve always had a dream to build a debugging tool to automatically analyze an observational dataset and tell me whether this dataset is suitable to apply batch-RL algorithms like DQN/DDPG. As we know, we cannot directly control or even know how observational dataset is collected. An incorrect data collection procedure or a wrong dataset would be costly to the whole model training loop [12]. My idea has been that this tool should first tell if the process underlying the dataset is an Markov Decision Process (MDP). By definition, in an MDP,  (next state) is a function of
  (current state) and
  (action);
  (reward) is also a function of and . Thus, the goal of the debugging tool would be make causal inference on the observational dataset whether states and actions cause the change of rewards and state transitions.
I will start with some Causal 101. I read some primers on causal inference [1, 2, 3, 4], among which [1] has a lot of good concise summary. The biggest take-away from [1] is that causation is not prediction. The second take-away is that there are two fundamental questions regarding causal effects: (1) estimating causal effect on a known relationship X->Y (2) causal relationship discovery, which [1] claims to be statistically impossible but I don’t understand why. For (1), we can use randomization experiments in which we assure X is changed independently and then observe how Y changes, or we can account for confounding variables in models. In a special case where we account for all confounding variables in a linear regression model (based on subject matter knowledge), the coefficient for X would be the perfect estimate of the causal effect of X->Y.
Regarding (2) causal relationship discovery, I’ve seen several papers researching on the topic. There are generally three ways to discover causal relationship. The first is to use noise model. In the additive noise model (a bivariate model), with the assumption that if X->Y but not Y->X, if you train two regression models  and
and  , you will find that
  is independent of
  while
while  is not independent of
  . See [5, 6]. The noise independence test can be done through kernel-based test (see reference in [6]). The only situation where this method cannot distinguish the causal direction is when X and Y have a linear relationship and their noise is Gaussian. The second method is related to the Kolmogorov complexity. Theorem 1 from [7] states that under some assumptions if X->Y then
  , which can be proxied as so called pinball loss. Then quantile regression (regression using pinball loss) can be fitted for X to Y and Y to X. The direction with lower pinball loss would indicate the causal relationship. The third method is called matching. While there are several methods for matching, we talk about a widely adopted one called propensity score matching. The idea is that you group events together with similar propensity scores. The propensity score of an event is how likely it happens. Once similarly likely events are grouped together, you can further divide them by whether they receive some “treatment” and compute causal effect. One good example of applying propensity score matching is from an NLP work [11] where they probe which word causes positive or negative emotions. Some people criticize propensity score matching for its drawbacks [9, 10] and there are more matching methods to be considered [10]. We need to be very careful about the assumptions of these methods, since many of them cannot work when confounding variables are present.
Next, I will go with uncertainty 101. Uncertainty of deep neural networks is a really fascinating topic to me: we can almost fit anything using deep neural networks but that doesn’t tell much if without uncertainty estimation. There are multiple ways to give uncertainty estimation of a deep NN:
- High-Quality Prediction Intervals for Deep Learning: A Distribution-Free, Ensembled Approach: https://arxiv.org/pdf/1802.07167.pdf. The loss function is based on the idea that high-quality PIs should be as narrow as possible subject to a given coverage proportion, where coverage means that the proportion of data with label
 lies within the predicted interval
 ![[y_l, y_u]](https://czxttkl.com/wp-content/ql-cache/quicklatex.com-27d4a8ffbaed137ccc15f962a9474686_l3.png "Rendered by QuickLaTeX.com") .
. - Dropout as a bayesian approximation: Representing model uncertainty in deep learning: https://arxiv.org/abs/1506.02142. At testing time, dropout is applied on a trained neural network multiple times to get multiple predictions. Predictive intervals are computed empirically from the obtained samples.
- Simple and scalable predictive uncertainty estimation using deep ensembles: https://arxiv.org/abs/1612.01474. Conceptually this is the most straightforward idea where an ensemble of models can give you a distribution of predictions. This idea is used in RL model-based planning, Deep Reinforcement Learning in a Handful of Trials using Probabilistic Dynamics Models: https://arxiv.org/abs/1805.12114.
- Frequentist Uncertainty Estimates for Deep Learning: http://bayesiandeeplearning.org/2018/papers/31.pdf. Uncertainty estimate by quantile regression. A more detailed version: https://arxiv.org/abs/1811.00908
- Conservative Uncertainty Estimation by Fitting Prior Networks: https://openreview.net/pdf?id=BJlahxHYDS. Like Bayesian Optimization, uncertainty actually doesn’t rely on data labels.
After introducing causal and uncertainty 101, let’s dive into the debugging tool in my mind. Since any observational dataset may contain confounding issues and spurious correlation, we cannot really trust any observational dataset. Rather, the only trustful dataset is to collect (s,a,r,s’) using a completely random policy.
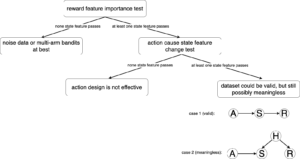
First, we need to debug if is a function of and . This is done by computing feature importance for each state feature and each action feature. Feature importance is obtained by the change of reward prediction after masking one particular feature for all logged data on a trained and fixed reward model. The intuition is that if a feature is important, masking it should bring significant agitation in the reward prediction. If no state feature is important, then this problem can degenerate to be a multi-arm bandit problem at best when action feature is important. We can use the uncertainty work we surveyed to get a confidence bound for the estimated feature importance, and we expect the lower confidence bound should be above 0. We call the test of whether lower confidence bound > 0 in at least p% logged data as feature importance significance test. (Update 2021-02-10: there is a clever way to do feature importance called Boruta: https://towardsdatascience.com/boruta-explained-the-way-i-wish-someone-explained-it-to-me-4489d70e154a)
Since our data is randomized on actions, any action feature that passes the feature importance significance test can be equivalent to say that action causes reward. But if a state feature passes the feature importance significance test, we can only say the state feature is correlated with the reward. This is because we could have one of the following causal relationships. In the latter case, a confounding factor causes the state feature and the reward.
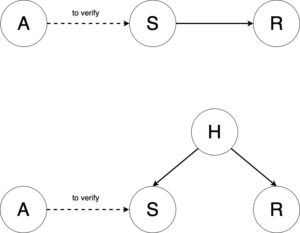
That’s why even if there are states that are important for rewards it is not enough. More specifically, there are two concerns that things could go wrong: (1) what if actions couldn’t exert any influence on the states that are important to rewards? (2) what if actions can make influence on a state that is considered important for reward prediction, but that state is not the cause of the reward but merely correlated with the reward? For (1) we need to debug if is a function of and . We train next state prediction models for each state feature, and by shuffling action values, we can see how next state prediction changes, whose magnitude will be used as proxy for action influence on that state feature. To account for data variance (aleatoric error), we can fit mixture density distributions on next states.
For (2) “what if actions can make influence on a state that is considered important for reward prediction, but that state is not the cause of the reward but merely correlated with the reward”, I think here is a good example to illustrate the point. Suppose there is a state feature “ads view of a particular product”, action is “whether show more ads about the product”, reward is “purchase of the product”. Suppose there is a confounding variable “passion about the product” that actually causes views and purchases. While the action can increase more views, the state feature and reward are independent once we know if a person loves the product. In this case, even some state features pass reward feature importance significance test and are caused by actions, we will still be unsure whether the problem is meaningful to apply for RL.
Overall, the debugging tool procedure can be summarized as:
—————— this part may not be useful ———————
Suppose there are two users (mdp_id=0, and mdp_id=1). User 0 loves the product thus every ad view would lead to purchase. User 1 hates the product thus ad view has no effect on him.
| mdp_id | time_step | passion (s_t) | views (s_t) | action (a_t) | purchase (r_t) |
| 0 | 0 | 1 | 0 | show | 1 |
| 0 | 1 | 1 | 1 | not show | 0 |
| 0 | 2 | 1 | 1 | show | 1 |
| 0 | 3 | 1 | 2 | not show | 0 |
| 1 | 0 | 0 | 0 | show | 0 |
| 1 | 1 | 0 | 0 | not show | 0 |
If passion and view are both state features, and purchase is a function of (passion, action), then passion will be considered important for rewards but not views. Then for passion, we will find that actions couldn’t change it, which indicates this problem is not suitable for RL.
If passion and view are both state features, and purchase is a function of (passion, views, action) (e.g., there is additional purchase decay due to accumulated views), then passion and view will both be considered important for rewards . We will find that action couldn’t change passion but views, which concludes that this dataset is valid for trying RL.
If passion is unobservable and only views is observable, and purchase is a function of (passion, action), then no feature will be considered as important for reward prediction. Our tool would raise flag immediately.
If passion is is unobservable and only views is observable, and purchase is a function of (passion, views, action), then views will be recognized as important for rewards. We will find out actions could change views and conclude that this data is still valid for trying RL.
When passion is unobservable and only views is observable, and purchase is a function of (passion, action), and passion=1 by nature has far more data than passion=0.
—————— this part may not be useful ———————
References
[1] http://www.stat.cmu.edu/~larry/=stat401/Causal.pdf
[2] causal-inference.org: https://sites.google.com/view/causality-reading-group/resources?authuser=0
[3] Elements of Causal Inference: https://library.oapen.org/bitstream/handle/20.500.12657/26040/11283.pdf?sequence=1&isAllowed=y
[4] Review of Causal Discovery Methods Based on Graphical Models: https://www.frontiersin.org/articles/10.3389/fgene.2019.00524/full
[5] Nonlinear causal discovery with additive noise models: https://papers.nips.cc/paper/3548-nonlinear-causal-discovery-with-additive-noise-models
[6] On the Identifiability of the Post-Nonlinear Causal Model: https://arxiv.org/pdf/1205.2599.pdf
[7] Distinguishing Cause from Effect Using Quantiles: Bivariate Quantile Causal Discovery: https://arxiv.org/abs/1801.10579
[8] Frequentist Uncertainty Estimates for Deep Learning: http://bayesiandeeplearning.org/2018/papers/31.pdf
[9] https://en.wikipedia.org/wiki/Propensity_score_matching#Advantages_and_disadvantages
[10] Why Propensity Scores Should Not Be Used for Matching: https://www.cambridge.org/core/journals/political-analysis/article/why-propensity-scores-should-not-be-used-for-matching/94DDE7ED8E2A796B693096EB714BE68B
[11] Feature Selection as Causal Inference Experiments with Text Classification: https://www.aclweb.org/anthology/K17-1018/
[12] Everyone wants to do the model work, not the data work”: Data Cascades in High-Stakes AI: https://storage.googleapis.com/pub-tools-public-publication-data/pdf/0d556e45afc54afeb2eb6b51a9bc1827b9961ff4.pdf