In my opinion, buying ETFs is a good investment method that has decent average return and low risk. My buy philosophy is to buy ETFs in fixed amount and fixed intervals, say every pay check you allocate $2000 to purchase ETFs, regardless whether their prices are high or low. My sell philosophy is inspired from Benjamin Graham with the following two conditions: (1) When E/P ratio (earning / price, i.e., the inverse of P/E ratio) is below 10%, pause investing; (2) If E/P ratio is below 2 times 10yr treasury interest, sell. Basically, E/P ratio can be roughly thought of the interest rate of your investment in stocks. If it is too low, then other investment methods such as treasury become relatively more attractive.
Now with my philosophy explained, I’m sharing some online tools that help implement my philosophy.
(1) 10-yr treasury interest: https://www.marketwatch.com/investing/bond/tmubmusd10y?countrycode=bx
(2) E/P ratio (or P/E ratio) of ETFs can be found in several websites. I am using FCA (First Trust China AlphaDEX Fund) as an example:
(a) https://www.etf.com/FCA#overview. Search “Price / Earning Ratio”
(b) https://ycharts.com/companies/FCA. Search “Weighted Average PE Ratio”.
(3) You can find ETFs with the lowest P/E ratios here: https://etfdb.com/compare/lowest-pe-ratio/.
The problems of using E/P ratio to screen ETFs go back my loose thought of E/P ratio as “the interest rate of investment in stocks”. E/P is the ratio of the current earning and the current price. Even though the current price can reflect investors’ future prospect, the current earning can’t reveal long-term performance. There could be high-risk ETFs with very high E/P ratio at the moment but you still don’t want to buy them. That’s why from https://etfdb.com/compare/lowest-pe-ratio/ you may see some ETFs tracking small countries’ risky economy among those lowest P/E ratio ETFs.
Because the absolute E/P ratio might not be as indicative, I think it is very desirable to know the percentile of the current E/P ratio in the same ETF’s history. I only know two websites that maintain this statistics for Chinese ETFs: https://qieman.com/idx-eval and https://danjuanapp.com/djmodule/value-center?channel=1300100141. I also know some websites with historical E/P ratio only for big names indices, such as S&P 500 or Nasdaq: https://www.quandl.com/data/MULTPL/SP500_PE_RATIO_MONTH-S-P-500-PE-Ratio-by-Month or https://www.multpl.com/s-p-500-pe-ratio/table/by-month.
Nevertheless, you can query individual stocks’ P/E ratio from https://ycharts.com/companies/FB/pe_ratio (replace FB with other companies you want to query) or using wolfram alpha https://www.wolframalpha.com/input/?i=p%2Fe+fb. You can then compute an ETF’s P/E ratio by weighting all individuals’ P/E ratio: https://money.stackexchange.com/questions/96998/how-can-i-tell-if-an-etf-is-expensive.
Update 2020-03
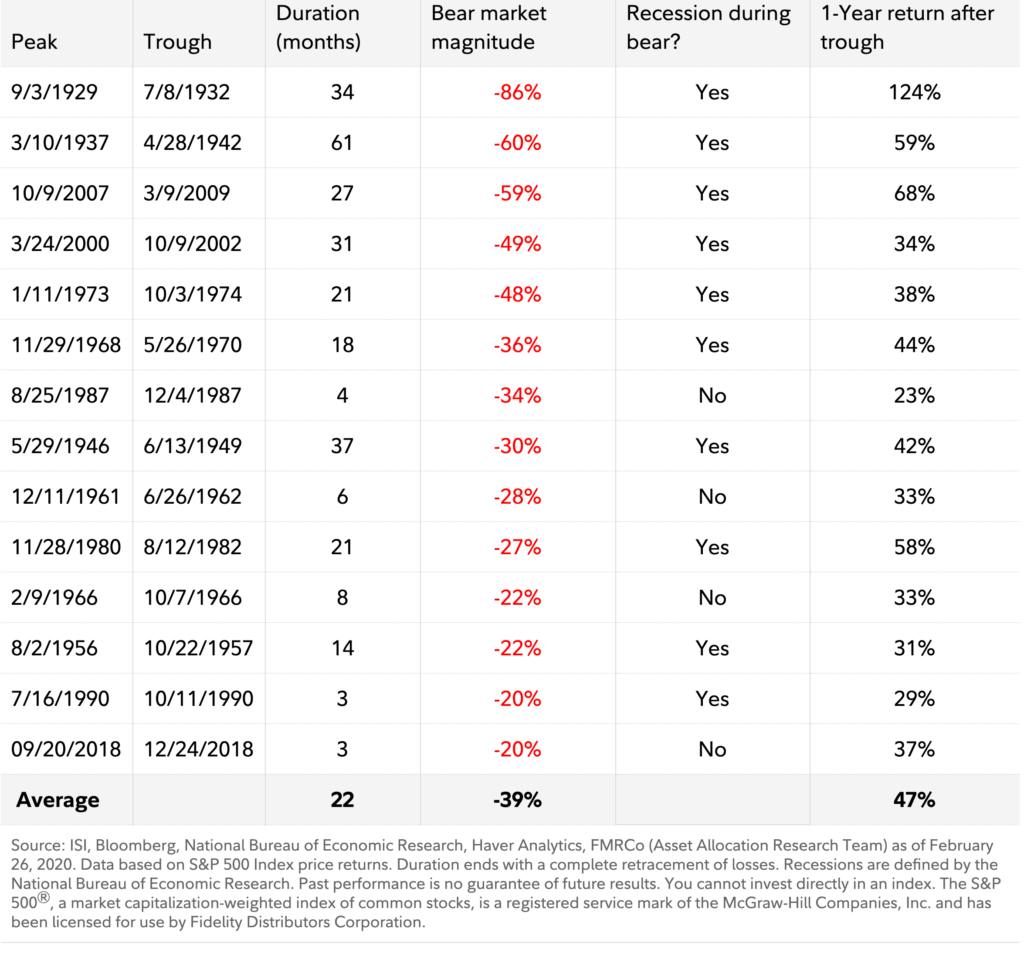
Another evidence that could boost your confidence in buying ETFs is the form below showing the duration of all historical bear markets (https://www.fidelity.com/viewpoints/market-and-economic-insights/bear-markets-the-business-cycle-explained, this link may have expired, you can checkout this pdf 10 things you should know about the bear market). On average, bear market can last 22 months, which means if you can sustainably make investment in ETFs, you will eventually survive with a huge return. I also checked that 75% and 95% percentile of bear market duration is 30 and 45 months.
Here is another data only from 1965 to 2019. It also shows the duration from trough to next peak:

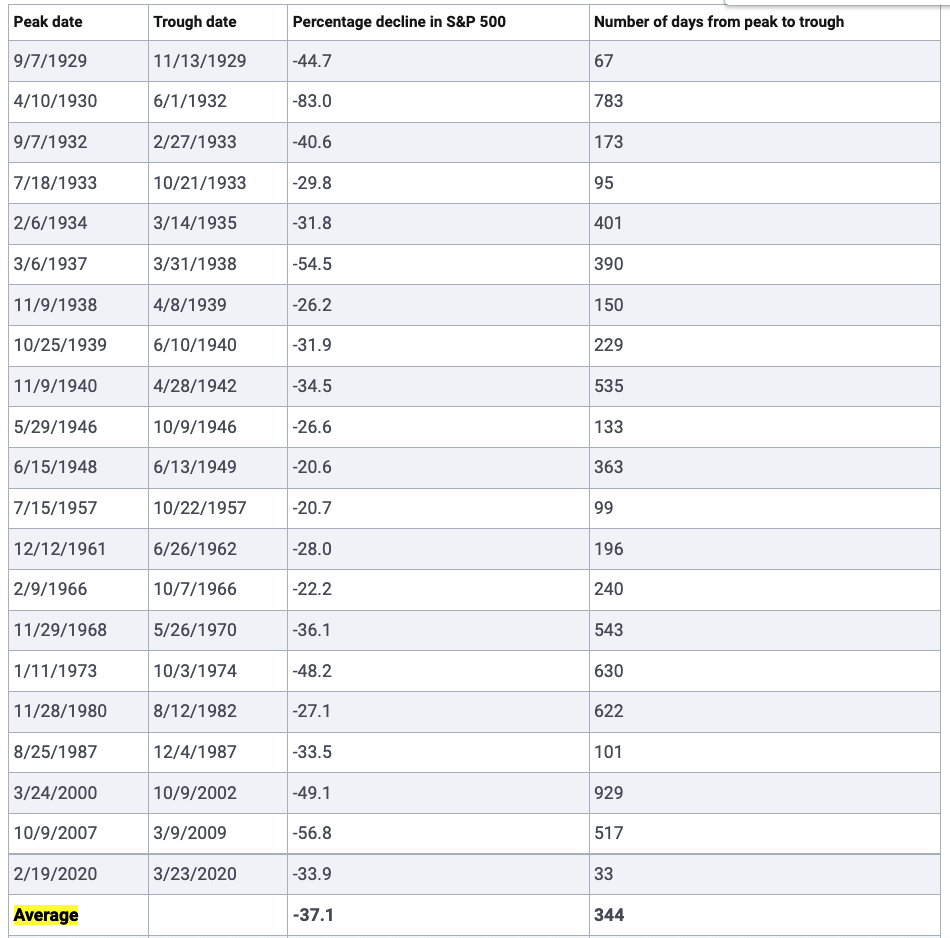
Another post to show historical peak-to-trough (https://www.bankrate.com/investing/how-long-will-bear-market-last/):
—————– Update 08/12 2020 ————————-
The trough after the peak in 2020-02-20 happened on 03-23 (2237). It then recovered on 08-12 (3380). Therefore, the peak to trough lasts 32 days, while the recovery takes 142 days.
I also want to talk about municipal bond and treasury ETFs. They are less risky than stock ETFs and hence have lower returns. But they are still good investment to dilute your risk. You can find all municipal bond ETFs at https://etfdb.com/etfs/bond/municipal-bond/#etfs__dividends&sort_name=assets_under_management&sort_order=desc&page=1 and all treasury ETFs at https://etfdb.com/etfs/bond/treasuries/#etfs__dividends&sort_name=dividend_yield&sort_order=desc&page=1. The most famous municipal bond ETF is MUB, with much stable price and decent dividend yield (2.23% annual yield checked on 08-12-2020). The treasury ETFs usually have higher fluctuation and more returns on average. You can check the following chart to decide based on your risk favor (https://rich01.com/bond-etf-treasuries-5/):

In my experience, MUB strikes the best balance between volatility and dividend yield. In other words, ETFs that have higher dividend yields than MUB usually have higher volatility.
You can also buy ETFs that track US bond market (BND) and international bond market (BNDX).
—————– Update 08/21 2020 ————————-
From https://www.youtube.com/watch?v=0eM1jYV0j-k and https://www.youtube.com/watch?v=Co7ih4M4AAg, I know some other good ETF candidates too:
1. VGT: technology companies weighted by their values. If you compare with QQQ which tracks Nasdaq, you’ll find it even performs better in the last 5 years and even with higher dividend! https://etfdb.com/tool/etf-comparison/QQQ-VGT/#performance
2. VYM high dividend ETF. Again it is more volatile than MUB and has just marginally better dividend yield.
3. VT. ETF tracking the entire world’s stock market including US. You can also look at VXUS, the world market except US.
4. YYY or PCEF, high yield ETF but may have some risk: https://fburl.com/19il38ry. Also look at HYG and SDIV.
Also, it is good to consider leveraged ETFs for holding short time. For example, this is a strategy I’d like to try in the next bear market: when the bear market establishes and has lasted for more than 50-percentile of the historical bear market duration, we can start pouring money into TQQQ, the 3x leveraged ETF tracking Nasdaq. Generally leveraged ETFs is not recommended for long-term investment. See discussion at Reddit:
Comment
byu/iamagoodpanda from discussion
ininvesting
However, another post (https://seekingalpha.com/article/4416406-tqqq-long-term-hold-viable-dca-only-for-those-highest-risk-tolerance) did backtests and concluded that investing TQQQ in fixed interval has much better return, but its volatility is huge – sometimes you may see 90% loss in economic crashes.
—————– Update 12/08 2020 ————————-
I read this interesting article (https://stocknews.com/news/gof-sdy-sdiv-pfl-glo-warning-this-etf-could-ruin-your-retirement/) saying that closed-end funds (CEFs) are better than high-yield ETFs because the former are more actively managed thus are subject to more stable price. I also observed that high-yield ETFs like SDIV and YYY have price losses over time. The article gives several CEFs in the order of performance as of Sept. 2020: GOF, PFL, GLO.
I find that Fidelity has great UI for comparing loss. Here are examples:
https://screener.fidelity.com/ftgw/etf/goto/snapshot/performance.jhtml?symbols=GOF
https://screener.fidelity.com/ftgw/etf/goto/snapshot/performance.jhtml?symbols=YYY
https://screener.fidelity.com/ftgw/etf/goto/snapshot/performance.jhtml?symbols=SDIV
Update 08/30/2021
Someone says maintaining TQQQ/TMF = 60%/40% is a good strategy: https://www.optimizedportfolio.com/tqqq/