The following tables were generated right after a simple linear regression with three independent variables was fit in SAS:
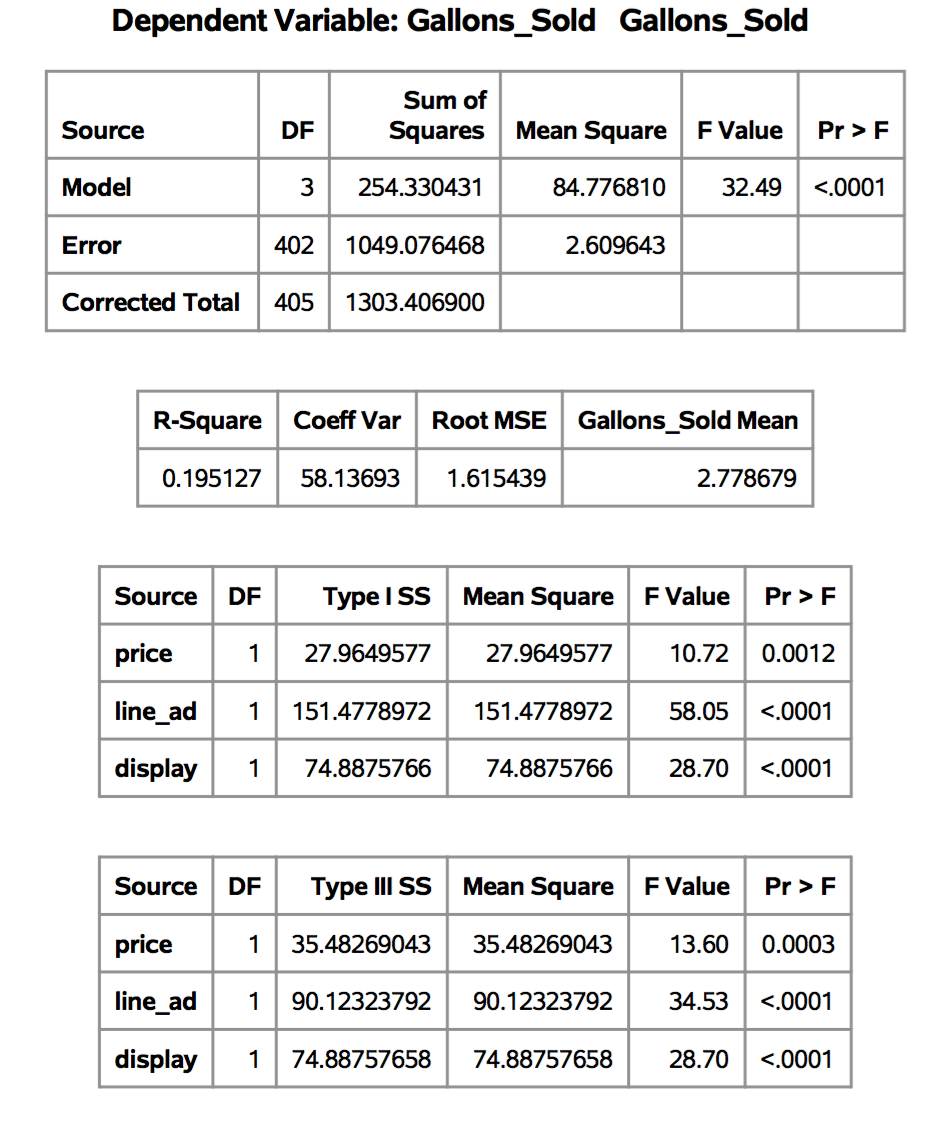
The linear regression is Gallons_sold ~ price + line_ad + display.
I will mainly illustrate how to read the first table. To give you a background, the number of samples is $latex n=406$ and the number of independent variables is 3. We set $latex p=4$ as the number of independent variables plus 1 which denotes the intercept term.
The first row of the first table:
The sum square of model is defined as: $latex SSM=\sum\limits_{i=1}^{n} (\hat{y}_i – \bar{y}_i)^2$
Degrees of freedom of SSM: $latex p-1$. An not very intuitive explanation is that when you are given $latex n$ data samples $latex (\vec{x}_1, y_1), \cdots, (\vec{x}_n, y_n)$, and you are given an SSM, then you can freely fluctuate up to $latex p-1$ data samples and adjust the remaining $latex n-p+1$ data samples to make the fitted regression based on all the $latex n$ samples achieves the same SSM.
The second row of the first table:
The sum square of error is defined as: $latex SSE=\sum\limits_{i=1}^{n} (\hat{y}_i – y_i)^2 $
Degrees of freedom of SSE: $latex n-p$
The third row of the first table:
The corrected sum square of total is defined as: $latex SST=\sum\limits_{i=1}^{n} (y_i – \bar{y}_i)^2$
Degrees of freedom of SST: $latex n-1$
F-value in the first row is the result of F-test, which tests whether your fitted linear regression is equal to a fit of intercept-only model. More details about F-test can be found in references.
$latex Fvalue = \frac{MSM}{MSE}=\frac{\frac{SSM}{DF_{model}}}{\frac{SSE}{DF_{error}}} &s=2$
The p-value of F-value is obtained by looking up F-value table, which takes three parameters: F-value, degrees of freedom of numerator and degrees of freedom of denominator.
Reference:
[1] http://facweb.cs.depaul.edu/sjost/csc423/documents/f-test-reg.htm