While ROC (receiver operating characteristic) curve is ubiquitous in model reporting, Precision Recall Curve is less reported. However, the latter is especially useful when we have imbalanced data. Let’s review pertinent concepts.
True Positive = TP = you predict positive and the actual label is positive
False Positive = FP = you predict positive but the actual label is negative
True Negative = TN = you predict negative and the actual label is negative
False Negative = FN = you predict negative and the actual label is positive
TPR = True Positive Rate = Sensitivity = Recall = TP / (TP + FN)
FPR = False Positive Rate = FP / (FP + TN). Among all negative samples (FP + TN), how many of them are erroneously identified as positive (FP). FPR will increase if you blindly increase the probability threshold for predicting negative. In an extreme case, you can just predict every sample as positive.
Precision = TP / (TP + FP). Among all the predicted positive samples (TP + FP), how many of them actually have positive labels.
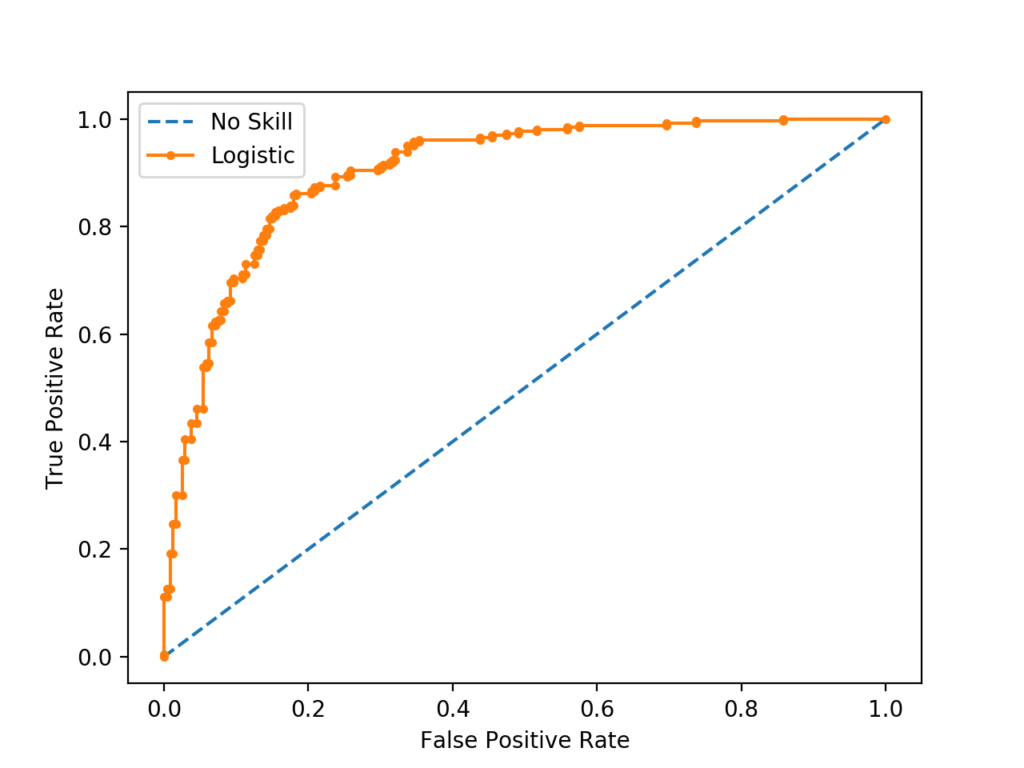
For an ROC curve, the x-axis is FPR and the y-axis is TPR.
For a Precision-Recall curve, the x-axis is Recall and the y-axis is Precision.

Now, let’s look at an example with imbalanced data, in which case the Precision-Recall curve is more informative than the ROC curve (https://www.kaggle.com/general/7517).
Suppose there is 1 million documents, among which 100 documents are relevant, and two methods to retrieve them. At some decision threshold for method 1 and some other decision threshold for method 2, we have:
- Method 1 (@some decision threshold): 100 retrieved documents, 90 relevant
- TP=90, FP=10, TN=1M-100-10, FN=10
- FPR = FP / (FP + TN) = 10 / (1M – 100) =0.000010001, TPR = TP / (TP + FN) = 90 / (90 + 10) = 0.9,
- Recall = TPR = 0.9, Precision = TP / (TP + FP) = 90 / (90 + 10) = 0.9
- Method 2 (@some decision threshold): 2000 retrieved documents, 90 relevant
- TP=90, FP=1910, TN=1M-2000-10, FN=10
- FPR = FP / (FP + TN) = 1910 / (1910 + 1M – 2000 – 10) = 0.00191019101, TPR = TP / (TP + FN) = 90 / (90 + 10) = 0.9
- Recall = TPR = 0.9, Precision = TP / (TP + FP) = 90 / (90 + 1910) = 0.045
Note that, the calculation is just for one point on the ROC / Precision-Recall curve. We can already see that their ROC would not be too different (at same TPR, FPR is 0.000010001 vs. 0.00191019101). But PR curve would be more different, since at the same recall, the precisions is 0.9 vs. 0.045.