I wrote a post before talking about sum-product algorithm: http://maider.blog.sohu.com/307377602.html
At that time, I had fresh memory on how graph model works. However, today when I read the post again, I am lost again. Therefore, I want to recap the basic motivations of graph models. This post can serve as an intro to the old post. I think remembering the motivations for an algorithm is really more important than details in it.
What does a Graph Model represent?
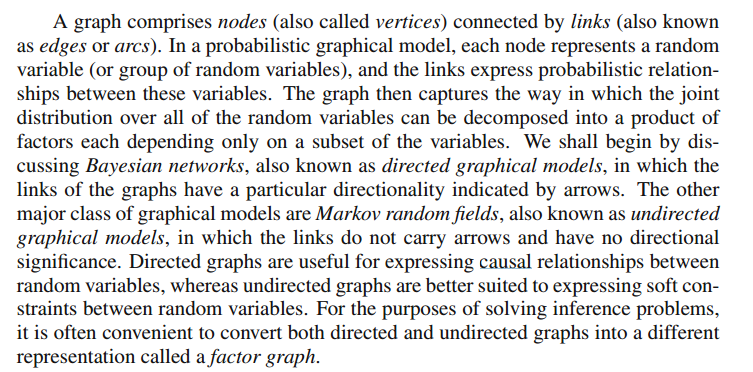
A graph model represents a joint distribution of all variables appearing in the a graph. There are three types of graph models, one is directed, one is undirected graph model, and the other is factor graph. For me, I find directed model is really intuitive because you can tell casual relationship from it. (See below the directed graph of the sex-gender-disease example I made in the sum-product algorithm post.) I am less familiar with undirected graph model, though. The factor graph is usually converted from directed/undirected graph model for inference learning purpose. So no matter what is your original graph model (directed or undirected), all learning algorithms take place at corresponding factor graphs.
A summary from Bishop’s book:
Another summary from his paper:

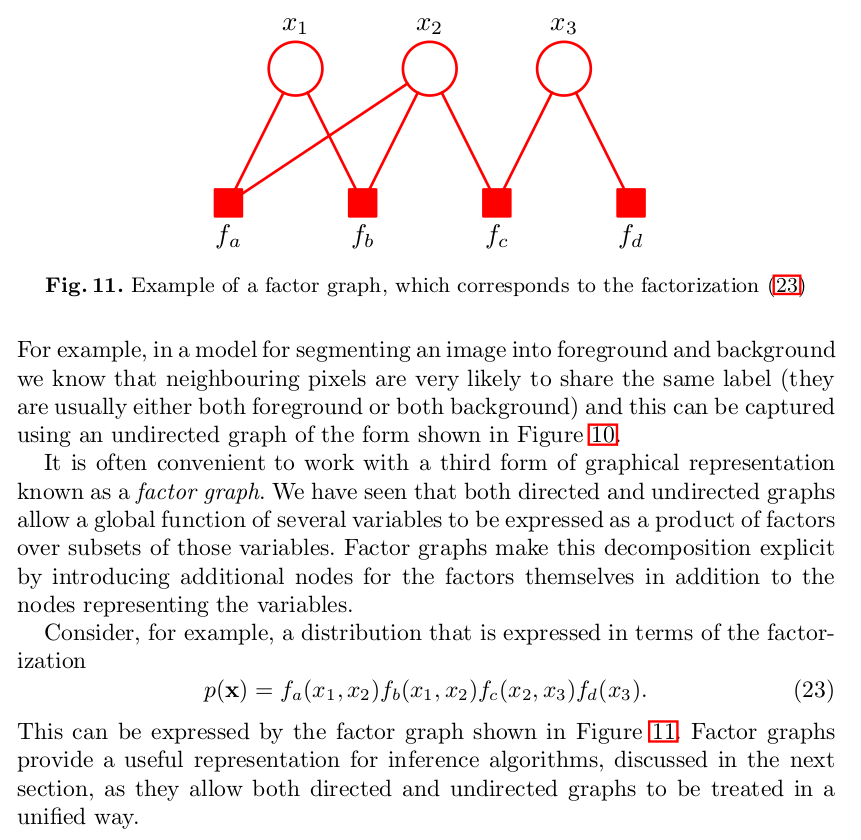
Factor Graph
A factor graph consists of multiple factors, each is a clique connecting a fraction of total variables. Say you have want to calculate marginal distribution $latex p(x_i)$ from the joint distribution $latex p(x_1, x_2, \cdots, x_N)$. The naive way to calculate that is:
- get all possible configuration of $latex (x_1, x_2, \cdots, x_{i-1}, x_{i+1}, \cdots, x_N)$.
- for each configuration $latex \hat{x}$, you calculate the joint probability of $latex p(x_i, \hat{x})$
- Sum all the joint probabilities under all configurations, which equals to $latex p(x_i)$.
If $latex x_1$ can take $latex |x_1|$ different values, $latex x_2$ can take $latex |x_2|$ different values, …, we will need to sum up $latex \prod\limits_{j \neq i} |x_j|$ joint probabilities.
Factor graph helps eliminate unnecessary computation. For example, if we have only four variables and the joint distribution is $latex p(x_1, x_2, x_3, x_4) = p(x_1)p(x_2|x_1)p(x_3|x_2)p(x_4|x_3) &s=2$, then $latex p(x_4)=\Big[\sum\limits_{x_3}p(x_4|x_3)\big[\sum\limits_{x_2}p(x_3|x_2)[\sum\limits_{x_1}p(x_1)p(x_2|x_1)]\big]\Big] &s=2$. Now you only need to compute addition operation $latex |x_1||x_2| + |x_2| + |x_3| $ times.
What does Sum-Product algorithm do?
Sum-Product algorithm can easily calculate the marginal probability of any variable in the model. It, however, is not an inference learning algorithm. (i.e., it is not used for learning parameters in a graph model.)
What do inference algorithms do?
Inference algorithms learn the parameters of graph models. After that, you can use sum product algorithm to calculate marginal probability of any variable in the model.