Use `rsync` with `-n` (dry run) so that it lists diff files but will not execute syncing.
rsync -n -avcr --delete local_folder/ username@domain:remote_folder/
Use `rsync` with `-n` (dry run) so that it lists diff files but will not execute syncing.
rsync -n -avcr --delete local_folder/ username@domain:remote_folder/
Hidden Markov Model
You should bear in mind clearly the three questions people usually ask for Hidden Markov Model:
1. what is the probability of an observed sequence?
2. what is the most likely series of states given a specific observed observation?
3. Given a set of observations, what are the values of the state transition probabilities and the output emission probabilities?
ref:
http://cs229.stanford.edu/section/cs229-hmm.pdf
http://mlg.eng.cam.ac.uk/zoubin/papers/ijprai.pdf
I’ve been struggled about where to put test files in a python project for a long time. Ideally, I think it is succinct to create a folder called “test” with all test files in it. However, the test files nested in the test folder need to import modules from parent folder. It is troublesome to import Python module from parent directory as you can’t just use `import ../module`. Here are the two correct ways to put test files in the test folder nested in a Python project:
In this post, I am going to introduce my favorite way to make cells in Jupyter notebook run in parallel.
1. Initialize cluster using command lines or use Python `popen` (In the example below, I create a cluster with 2 workers):
from subprocess import Popen
p = Popen(['ipcluster', 'start', '-n', '2'])
2. Then, programmatically set up the client. I usually set each worker non-blocking so that even when workers are running heavy tasks I can still do experiments in other cells:
from ipyparallel import Client
rc = Client()
dview = rc[:]
print "%d workers are running" % len(rc)

e0 = rc[0]
e0.block = False
e0.activate('0')
e1 = rc[1]
e1.block = False
e1.activate('1')
3. Then, to run one cell, add the magic command `%px0` at the first line of the cell. Here `0` means you designate the cell to be run on the first worker. You can replace `0` with any number as long as it is within the number of your workers. Here is one example:
%%px1
# An example of asynchronous parallelism
print len(df)
import time
c = 0
print time.time()
while c < 3:
    time.sleep(3)
    c += 1
print time.time()
4. You can think each cell starting with `%px[num]` as an independent workspace. Therefore, you need to explicitly import modules or data objects you want to use within the parallel cells. For example, in the example above, I must write `import time` in order to use the `time` module in the cell. The alternative is to import module/data programmatically:
# push data to all workers. the passing objects must be in a dict form.
dview.push({'churn':churn, 'data_end_date':data_end_date, 'CHURN_INT':CHURN_INT})

# import any modules you want
with dview.sync_imports():
    import sys
5. Finally, to get results, use `%pxresult0` (Similarly, you can replace `0` with other number denoting specific worker.)
%pxresult0
Note that `%pxresult0` is blocking if the result has not come out yet. If you want to do experiments in other cells, don’t run `%pxresult0` too early.
Reference:
http://minrk.github.io/drop/nbconverttest.html
https://ipython.org/ipython-doc/3/parallel/magics.html (for old ipython notebook)
http://ipyparallel.readthedocs.io/en/latest/ (for jupyter)
The best way to convert a tex file to docx is to: use Mircosoft Office Word 2013 or later to open the pdf file generated by .tex file. Word will convert pdf to docx with pretty format.
This post shows how to add customized permanent key bindings for jupyter notebook.
1. check the location of your jupyter config folder using the command:
sudo ~/.local/bin/jupyter --config-dir
I am running Ubuntu. The config folder, by default is, `/home/your_user_name/.jupyter`
2. Create a folder `custom` in the config folder.
3. Create a file `custom.js` in the `custom` folder. (So the path for `custom.js` is `/home/your_user_name/.jupyter/custom/custom.js`) Add your key binding function in `custom.js`. Here is an example adding a key bind combo for restarting and re-running all cells.
$([Jupyter.events]).on("app_initialized.NotebookApp", function () {
    Jupyter.keyboard_manager.command_shortcuts.add_shortcut('0,1', {
    help: 'restart and run all',
    help_index: '0,1',
    handler: function (event) {
      Jupyter.notebook.kernel.restart();
      setTimeout(function(){ Jupyter.notebook.execute_all_cells(); }, 1000);
      return false;
    }}
  );
});
4. Now restart the Jupyter and try press 0 followed by 1 in the command mode. All cells should be re-run after an one second delay.
Reference:
https://www.webucator.com/blog/2015/11/show-line-numbers-by-default-in-ipython-notebook/
http://stackoverflow.com/questions/32573958/how-to-bind-a-command-to-restart-and-run-all
In this post I am showing my understanding about the paper Adaptive Regularization of Weight Vectors: http://papers.nips.cc/paper/3848-adaptive-regularization-of-weight-vectors.pdf
The paper aims to address the negatives of a previous algorithm called confidence weighted (CW) learning by introducing the algorithm Adaptive Regularization Of Weights (AGOW). CW and AGOW are both online learning algorithms, meaning updates happen after observing each datum. The background under investigation is linear binary classifier, i.e., the algorithms try to learn weights $latex \boldsymbol{w}$ such that ideally given a datum $latex \boldsymbol{x}_t$ and its real label $latex y_t$, $latex sign(\boldsymbol{w} \cdot \boldsymbol{x}_t) = y_t$.
First, let’s look at the characteristics of CW. At each round $latex t$ where a new datum $latex (\boldsymbol{x}, y_t)$ is observed, CW aims to solve the following optimization problem:
$latex (\boldsymbol{\mu}_t, \Sigma_t) = \min\limits_{\boldsymbol{\mu}, \Sigma} D_{KL}(\mathcal{N}(\boldsymbol{\mu}, \Sigma) || \mathcal{N}(\boldsymbol{\mu}_{t-1}, \Sigma_{t-1})) \\ \qquad \qquad \text{ s.t. } Pr_{\boldsymbol{w} \sim \mathcal{N}(\boldsymbol{\mu}, \Sigma)}[y_t (\boldsymbol{w} \cdot \boldsymbol{x}_t) \geq 0] \geq \eta $
Interpreted in plain English, the optimization problem of CW says: I should make sure the current example can be predicted correctly with $latex \eta$ confidence by updating the underlying distribution of weights $latex \boldsymbol{w}$. However, the update should be as little as possible to preserve previous weights as much as possible.
The paper analyzes the positives and the negatives of CW: forcing the probability of predicting each example correctly to be at least $latex \eta$ (usually $latex > \frac{1}{2}$) can lead to rapid learning but suffer over-fitting problem if labels are very noisy. Also, the constraint, $latex Pr_{\boldsymbol{w} \sim \mathcal{N}(\boldsymbol{\mu},\Sigma)}[y_t (\boldsymbol{w} \cdot \boldsymbol{x}_t) \geq 0] \geq \eta$, is specific to linear binary classification problems, leaving people unknown how to extend to alternative settings.
The paper proposes AGOW with the following unconstrained optimization problem:
$latex C(\boldsymbol{\mu}, \Sigma) = D_{KL}(\mathcal{N}(\mu, \Sigma) || \mathcal{N}(\mu_{t-1}, \Sigma_{t-1}) ) + \lambda_1 \ell_{h^2}(y_t, \boldsymbol{\mu} \cdot \boldsymbol{x}_t) + \lambda_2 \boldsymbol{x}_t^T \Sigma \boldsymbol{x}_t \\ \text{ where } \ell_{h^2}(y_t, \boldsymbol{\mu} \cdot \boldsymbol{x}_t) = (\max \{ 0, 1 – y_t (\boldsymbol{\mu} \cdot \boldsymbol{x}_t) \} )^2 \text{ is a squared hinge loss function. }$
The optimization problem of AGOW aims to balance the following desires:
Now I will show how to derive the update rule for $latex \boldsymbol{\mu}$. Since $latex C(\boldsymbol{\mu}, \Sigma)$ is a convex function w.r.t. $latex \boldsymbol{\mu}$ and it is differentiable when $latex 1 – y_t(\boldsymbol{\mu}_t \cdot \boldsymbol{x}_t) \geq 0$, we can update $latex \boldsymbol{\mu}$ by setting the derivative of $latex C(\boldsymbol{\mu}, \Sigma)$ w.r.t to $latex \boldsymbol{\mu}$ to zero:
$latex \frac{\partial C(\boldsymbol{\mu}, \Sigma)}{\partial\boldsymbol{\mu}} = \frac{\partial}{\partial\boldsymbol{\mu}} \frac{1}{2}(\boldsymbol{\mu}_{t-1} -\boldsymbol{\mu})^T \Sigma_{t-1}^{-1}(\boldsymbol{\mu}_{t-1} -\boldsymbol{\mu}) + \frac{\partial}{\partial \boldsymbol{\mu}} \frac{1}{2r} \ell_{h^2}(y_t, \boldsymbol{\mu} \cdot \boldsymbol{x}_t) = 0$
Rearranging the equality above we can get formula (6) in the paper:
$latex \boldsymbol{\mu}_t = \boldsymbol{\mu}_{t-1} + \frac{y_t}{r}(1-y_t (\boldsymbol{x}_t^T \boldsymbol{\mu}_t)) \Sigma_{t-1} \boldsymbol{x}_t$
If we multiply both sides by $latex \boldsymbol{x}_t^T$, we get:
$latex \boldsymbol{x}_t^T \boldsymbol{\mu}_t = \boldsymbol{x}_t^T \boldsymbol{\mu}_{t-1} + \frac{y_t}{r}(1-y_t (\boldsymbol{x}_t^T \boldsymbol{\mu}_t)) \boldsymbol{x}_t^T \Sigma_{t-1} \boldsymbol{x}_t$
Moving everything containing $latex \boldsymbol{x}_t^T \boldsymbol{\mu}_t$ to the left we get:
$latex (1+ \frac{1}{r}\boldsymbol{x}_t^T \Sigma_{t-1} \boldsymbol{x}_t) \boldsymbol{x}_t^T \boldsymbol{\mu}_t = \frac{y_t}{r}\boldsymbol{x}_t^T \Sigma_{t-1} \boldsymbol{x}_t + \boldsymbol{x}_t^T \boldsymbol{\mu}_{t-1}$
Therefore,
$latex \boldsymbol{x}_t^T \boldsymbol{\mu}_t = \frac{y_t \boldsymbol{x}_t^T \Sigma_{t-1} \boldsymbol{x}_t + r \boldsymbol{x}_t^T \boldsymbol{\mu}_{t-1}}{r+\boldsymbol{x}_t^T \Sigma_{t-1} \boldsymbol{x}_t}$
Plugging the formula above back to where $latex \boldsymbol{x}_t^T \boldsymbol{\mu}_t$ appears in formula (6), we have:
$latex \boldsymbol{\mu}_t = \boldsymbol{\mu}_{t-1} + \frac{1 – y_t \boldsymbol{x}_t^T \boldsymbol{\mu}_{t-1}}{r+\boldsymbol{x}_t^T \Sigma_{t-1} \boldsymbol{x}_t} \Sigma_{t-1} y_t \boldsymbol{x}_t$
Recall the passive way AGOW adopts to update $latex \boldsymbol{\mu}_t$:
To combine these two update rules, we obtain the formula (7) in the paper:
$latex \boldsymbol{\mu}_t = \boldsymbol{\mu}_{t-1} + \frac{\max(0, 1 – y_t \boldsymbol{x}_t^T \boldsymbol{\mu}_{t-1})}{r+\boldsymbol{x}_t^T \Sigma_{t-1} \boldsymbol{x}_t} \Sigma_{t-1} y_t \boldsymbol{x}_t$
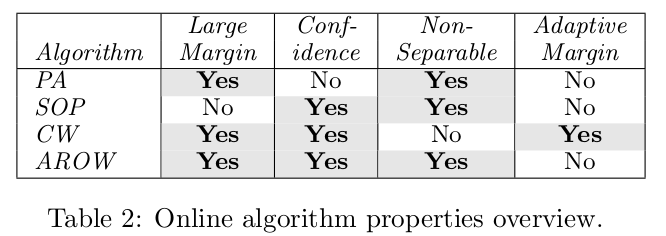
I skip the derivation for the update rule of $latex \Sigma$. The most important conclusion of the paper can be found in Table 2 where it summarizes pros and cons of state-of-the-art online learning algorithm.
In this paper I am trying to derive the mathematical formulas that appear in the paper Bayesian Probabilistic Matrix Factorization using Markov Chain Monte Carlo. We will use exactly the same notations as in the paper. The part that I am interested in is the Inference part (Section 3.3).
In Gibbs sampling, to sample one parameter, you need to determine its conditional distribution on other parameters. To sample $latex U_i$, we need to determine the distribution $latex p(U_i|R, V, \Theta_U, \Theta_V, \alpha)$. Since $latex U_i$ is independent to $latex \Theta_V$,$latex p(U_i|R, V, \Theta_U, \Theta_V, \alpha) = p(U_i | R, V, \Theta_U, \alpha)$.
According to the Bayesian rule, $latex p(U_i | R, V, \Theta_U, \alpha) \cdot p(R | V, \Theta_U, \alpha) = p(R | U_i, V, \Theta_U, \alpha) \cdot p(U_i | V, \Theta_U, \alpha) $. When we sample from $latex p(U_i | R, V, \Theta_U, \alpha)$, $latex R, V, \Theta_U$ and $latex \alpha$ are fixed. Therefore $latex p(R | V, \Theta_U, \alpha)$ can be seen as a constant. Also, in $latex p(U_i|V, \Theta_U, \alpha)$, $latex U_i$ and $latex V$ are independent, so $latex p(U_i|V, \Theta_U, \alpha)=p(U_i|\Theta_U, \alpha)$ .
Therefore, $latex p(U_i | R, V, \Theta_U, \alpha) \sim p(R | U_i, V, \Theta_U, \alpha) \cdot p(U_i |\Theta_U, \alpha)$. Before we go into further details, note that $latex p(R|U_i, V, \Theta_U, \alpha) = \prod\limits_{j=1}^M [\mathcal{N}(R_{ij}|U_i^TV_j, \alpha^{-1}) ]^{I_{ij}}$, a multiplication of $latex M$ normal distributions, and $latex p(U_i | \Theta_U, \alpha) = \mathcal{N}(U_i | \mu_U, \Lambda_U^{-1})$, another normal distribution, therefore $latex p(U_i|R, V, \Theta_U, \alpha)$ should also be an normal distribution because multiplication of multiple normal distributions results in another normal distribution with a scale factor (here the scale factor is $latex p(R|V, \Theta_U, \alpha)$).
To make things easier, let me introduce the canonical form of univariate and multivariate normal distributions. $latex \mathcal{N}(x | \mu, \sigma^2) = exp[\xi + \eta x – \frac{1}{2} \lambda^2 x^2]$ where $latex \lambda=\frac{1}{\sigma}$, $latex \eta=\lambda^2 \mu$ and $latex \xi = -\frac{1}{2}(\log 2\pi – \log \lambda^2 + \eta^2 \sigma^2 )$. $latex \mathcal{N}(\boldsymbol{x} | \boldsymbol{\mu}, V) = exp[\xi + \boldsymbol{\eta}^T \boldsymbol{x} – \frac{1}{2}\boldsymbol{x}^T \Lambda \boldsymbol{x}]$, where $latex \Lambda=V^{-1}$, $latex \boldsymbol{\eta} = V^{-1}\boldsymbol{\mu}$ and $latex \xi=-\frac{1}{2}(d\log2\pi-log|\Lambda|+\boldsymbol{\eta}^T \Lambda^{-1} \boldsymbol{\eta})$. (You can find some patterns of how the univariate case generalizes to the multivariate case as I arrange in this way.)
Now we proceed to expand $latex p(R | U_i, V, \Theta_U, \alpha)$ and $latex p(U_i | \Theta_U, \alpha)$ leveraging such canonical form.
$latex p(R|U_i, V, \Theta_U, \alpha) \\= \prod\limits_{j=1}^M [\mathcal{N}(R_{ij}|U_i^TV_j, \alpha^{-1}) ]^{I_{ij}} \\= \prod\limits_{j=1}^{M} exp[-\frac{1}{2}I_{ij}(\log 2\pi – \log \alpha + \alpha U_i^T V_j V_j^T U_i) + \alpha I_{ij} R_{ij}V_j^T U_i – \frac{1}{2} \alpha I_{ij} R_{ij}^2] \\=\prod\limits_{j=1}^M exp[-\frac{1}{2} \alpha I_{ij} U_i^T V_j V_j^T U_i +\alpha I_{ij} R_{ij}V_j^T U_i + C] \qquad\qquad (C \text{ is everything not relevant to } U_i) \\=exp[-\frac{1}{2} U_i^T (\alpha \sum\limits_{j=1}^M I_{ij} V_j V_j^T) U_i + \alpha\sum\limits_{j=1}^M I_{ij}R_{ij}V_j^T U_i + C]$
$latex p(U_i | \Theta_U, \alpha) \\=\mathcal{N}(U_i | \mu_U, \Lambda_U^{-1}) \\= exp[-\frac{1}{2} U_i^T \Lambda_U U_i + \Lambda_U \mu_U U_i + C]$
$latex p(U_i | R, V, \Theta_U, \alpha) \\ \sim p(R | U_i, V, \Theta_U, \alpha) \cdot p(U_i |\Theta_U, \alpha) \\= exp[-\frac{1}{2} U_i^T ( \Lambda_U + \alpha \sum\limits_{j=1}^M I_{ij} V_j V_j^T ) U_i + (\alpha\sum\limits_{j=1}^M I_{ij}R_{ij}V_j + \Lambda_U \mu_U) U_i + C]$
Compare the exp formula with the canonical form of a multivariate normal distribution you can get the mean and the variance. This is how formula (12) and (13) in the paper derive.
According to the Bayesian rule, $latex p(\Theta_U | U, \Theta_0) \cdot p(U | \Theta_0 ) = p(U|\Theta_U, \Theta_0) \cdot p(\Theta_U | \Theta_0)$.
Again, $latex p(U|\Theta_0)$ can be seen as a constant that can be ignored. Therefore,
$latex p(\Theta_U | U , \Theta_0) \\ \sim p(U|\Theta_U, \Theta_0) \cdot p(\Theta_U | \Theta_0) \\=p(U|\Theta_U, \Theta_0) \cdot p(\mu_U | \Lambda_U, \mu_0, \beta_0) \cdot p(\Lambda|W_0, v_0) \\=\prod\limits_{i=1}^N \mathcal{N}(U_i | \mu_U, \Lambda_U^{-1}) \cdot \mathcal{N}(\mu_U|\mu_0 , (\beta_0\Lambda_U)^{-1}) \mathcal{W}(\Lambda_U | W_0, v_0) \qquad\qquad \text{(Acrd. to Formula (5) and (7) in the paper)}$
Compare to formula 216~226 in Reference [5] and formula 1~3 in Reference [6] book page 178, you will get all derivations in formula (14) in the paper. However, it seems like the formulas for $latex S$ are different between the paper and the references. In the paper, $latex S=\frac{1}{N}\sum\limits_{i=1}^{N}U_i U_i^T$. In the reference, $latex S=\frac{1}{N}\sum\limits_{i=1}^{N}(U_i – N\bar{U}) (U_i – N\bar{U})^T$. This is the only place that confuses me and I have no answer for this before I go through all the proof in the reference.
Reference
[1] https://en.wikipedia.org/wiki/Multivariate_normal_distribution
[2] https://en.wikipedia.org/wiki/Normal_distribution
[3] http://www.tina-vision.net/docs/memos/2003-003.pdf
[4] http://blog.csdn.net/shenxiaolu1984/article/details/50405659
[5] https://www.cs.ubc.ca/~murphyk/Papers/bayesGauss.pdf
Gap statistic is often used to determine the best number of clusters. Please see a local version implementation for gap statistic here: https://github.com/echen/gap-statistic.
It is often desired to parallelize such tedious job to boost the speed. I implement a parallelized version basd on the source code:
library(plyr)
library(ggplot2)

# Calculate log(sum_i(within-cluster_i sum of squares around cluster_i mean)).
dispersion = function(data, num_clusters) {
  # R's k-means algorithm doesn't work when there is only one cluster.
  if (num_clusters == 1) {
    cluster_mean = aaply(data, 2, mean)
    distances_from_mean = aaply((data - cluster_mean)^2, 1, sum)
    log(sum(distances_from_mean))
  } else {
    # Run the k-means algorithm `nstart` times. Each run uses at most `iter.max` iterations.
    k = kmeans(data, centers = num_clusters, nstart = 5, iter.max = 50)
    # Take the sum, over each cluster, of the within-cluster sum of squares around the cluster mean. Then take the log. This is `W_k` in TWH's notation.
    log(sum(k$withinss))
  }
}

# For an appropriate reference distribution (in this case, uniform points in the same range as `data`), simulate the mean and standard deviation of the dispersion.
reference_dispersion = function(data, num_clusters, num_reference_bootstraps) {
  dispersions = maply(1:num_reference_bootstraps, function(i) dispersion(generate_uniform_points(data), num_clusters))
  mean_dispersion = mean(dispersions)
  stddev_dispersion = sd(dispersions) / sqrt(1 + 1 / num_reference_bootstraps) # the extra factor accounts for simulation error
  c(mean_dispersion, stddev_dispersion)
}


# Given a matrix `data`, where rows are observations and columns are individual dimensions, compute and plot the gap statistic (according to a uniform reference distribution).
gap_statistic = function(data, min_num_clusters = 1, max_num_clusters = 10, num_reference_bootstraps = 10) {
  # register parallelism backend
  library(doMC)
  registerDoMC(4)

  num_clusters = min_num_clusters:max_num_clusters
  actual_dispersions = maply(num_clusters, function(n) dispersion(data, n), .parallel = TRUE,
                             .paropts = list(.export=c("dispersion"),
                                             .packages=c("plyr")))
  ref_dispersions = maply(num_clusters, function(n) reference_dispersion(data, n, num_reference_bootstraps),
                          .parallel = TRUE,
                          .paropts = list(.export=c("dispersion", "reference_dispersion"),
                                         .packages=c("plyr")))
  mean_ref_dispersions = ref_dispersions[ , 1]
  stddev_ref_dispersions = ref_dispersions[ , 2]
  gaps = mean_ref_dispersions - actual_dispersions

  print(plot_gap_statistic(gaps, stddev_ref_dispersions, num_clusters))

  print(paste("The estimated number of clusters is ", num_clusters[which.max(gaps)], ".", sep = ""))

  list(gaps = gaps, gap_stddevs = stddev_ref_dispersions)
}

# Plot the gaps along with error bars.
plot_gap_statistic = function(gaps, stddevs, num_clusters) {
  qplot(num_clusters, gaps, xlab = "# clusters", ylab = "gap", geom = "line", main = "Estimating the number of clusters via the gap statistic") + geom_errorbar(aes(num_clusters, ymin = gaps - stddevs, ymax = gaps + stddevs), size = 0.3, width = 0.2, colour = "darkblue")
}

# Generate uniform points within the range of `data`.
generate_uniform_points = function(data) {
  # Find the min/max values in each dimension, so that we can generate uniform numbers in these ranges.
  mins = aaply(data, 2, min)
  maxs = apply(data, 2, max)

  num_datapoints = nrow(data)
  # For each dimension, generate `num_datapoints` points uniformly in the min/max range.
  uniform_pts = maply(1:length(mins), function(dim) runif(num_datapoints, min = mins[dim], max = maxs[dim]))
  uniform_pts = t(uniform_pts)
}
It uses `doMC` as parallelism backend. You can change how many cores it uses in line 32.
Use package `makecell`.